
Was Brazos Bend 100 2018 More Difficult Than Past Years?
Not a Race Report
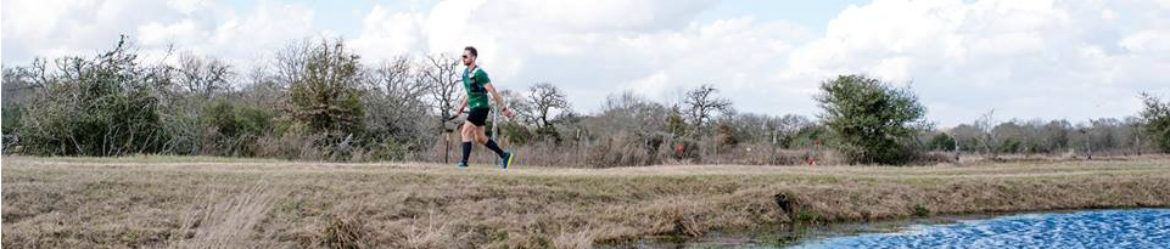
This year was my 3rd year running Brazos Bend 100. I had 2 goals going in: Run faster that previous years and finish in under 20 hours. Unfortunately, rain the day & night before turned the trails into a muddy, sloppy mess which negatively impacted my speed. I failed to meet either goal and finished in 23 hours 38 minutes and placed 28th out of 139.
Having run Brazos twice before, I don’t have much to say in a race report this time. The volunteers and race organizers were awesome, as they always are. Other than the trail conditions, nothing else significant stood out about the race.
- Past Brazos Bend 100 Race Reports
Instead, the thing that has been on my mind since the race is, “Was the 2018 Brazos Bend 100 significantly more difficult than previous years?”
Was Brazos Bend 100 2018 more difficult?
The first evidence that Brazos 2018 was more difficult was that it took me significantly longer than past races. In 2016, I finished in 20:24:15 and in 2017, I finished in 21:36:39. Finishing in 23:38:38 clearly indicates I had a harder time. Objectively thinking about it, my slower time could just be my issue – maybe I aged a great deal in the last year. More realistically, there are at least two things I can point to that would have impacted my time. First, my 2018 was focused on longer, more difficult races. I had been training for 200+ mile races. This means training at a slower pace and running more miles. Second, given the weather in the Austin, TX area, I don’t get a lot of opportunities to run/train in super muddy trails. I was not used to or confident running on the trail conditions of Brazos 2018.
I began to realize it was more than just me as I started to hit social media in the days following the race. My feeds had a greater number of people that Did Not Finish (DNF) at Brazos 100. Those that did finish were posting slower times.
“Hmm … maybe Brazos was more difficult this year,” I was thinking. “Now, I need to know. TO THE DATA!!”
To the Data
If you don’t know, I love data analytics. In fact, it is what I do for a living. Currently, I am the Director of Business Intelligence at my company. I look at, read, analyze, visualize, interpret and find insights in data just about every working day of the year.
I went to the Brazos Bend results on UltraSignup. There is data for the 100 mile race from 2014 to 2018. The good news was, there is a lot of data on the races. The bad news, I don’t know of an easy way to pull it all down. Given that I was just trying to answer the question “was 2018 more difficult than 2016 & 2017”, I felt confident I could use a subset of the data.
My first instinct was to pull the finish rates of each year.

Looking at the results, 2018 had the 2nd lowest finish rate of the years. Also, something clearly happened in 2015 to have such a low percentage of finishers. Since I did not race in either 2014 or 2015, I cannot speak to how different/similar the trail and route was to the races in 2016 through 2018. I really want to focus on just 2016-2018 because I know that the trails, routes, and aid stations were incredibly similar, if not the same all three years.
The finish rate for 2018 was lower than both 2016 and 2017, which lines up to my experience and the 2018 race experience I had been seeing on social media. But given the jump in the overall number of racers (almost 60% more) in 2017 and 2018, I don’t feel comfortable making any conclusions on the difficulty of the race without doing more investigation. For example, maybe 2018 seems more difficult because a larger number of inexperienced racers signed up to run the race. I wanted a way to remove the “inexperience racer” variable from my investigation.
Measuring the Elite Racers
In order to eliminate the “inexperienced racer” variable from my analysis, I decide to pull the finish times of the top 10 finishers each year. Why did I choose the top ten versus some other quantity? I wanted a large enough set that it would not be too skewed by one superstar runner. At the same time, pulling the data for each year is not an easy task. Looking at the different finish times, I felt confident that the impact of increasing the number of top finishers would not be worth the extra effort it would take to get the data.

The same patterns emerged in this data set compared to the finish rates. 2015 stands out as an outlier, for both the average finish time of the top 10 as well as the standard deviation of the top ten finish times. Like the previous finish rates data set, I cannot speak to how different/similar the 2014 and 2015 races were to the 2016-2018 races. I focused my analysis on just the 2016, 2017, & 2018 races.
The average finish time for the top ten runners in 2018 was longer than both 2016 and 2017.
In Conclusion
In conclusion, Brazos Bend 100 2018 was a more difficult race than both the 2016 and 2017 races. How much more difficult was the 2018 race?
It was less likely that a racer starting the 2018 race would finished compared to 2016 and 2017: 15% less likely to finish compared to 2016 and 9% less likely to finish compared to 2017. The top ten finishers in 2018 took longer to finish the race than in 2016 and 2017: about 1 hour and 40 minutes (+8.8%) more time than 2016 and about 1 hour and 38 minutes (+8.6%) more time than 2017.
Final Notes & Disclaimer:
I am by no means perfect when doing my analysis, especially while working on it across several sessions with big gaps in-between while in coffee shops or watching the kids. If you notice errors in my analysis or data or if you have questions about it, please let me know.
I am also very curious about what happened in 2015 at the Brazos Bend 100. If you were there and can provide insight into what happened to finish rates and the finish times of the top ten runners, I would love to hear more about it.


So much mud!!!